

Units of measure
MPG to L/100km conversion chart: blue: US gal, red: imp gal (UK)
The two most common ways to measure automobile fuel usage are:
Fuel consumption
the amount of fuel used per unit distance; most commonly, litres per 100 kilometres (L/100 km). This measure is used in Europe, China, Canada, Australia and New Zealand. Lower values mean better fuel consumption: you use less fuel to travel the same distance.
Fuel economy
the distance traveled per unit of fuel used; most commonly miles per gallon (mpg) or kilometres per litre (km/L). This measure is used in the UK, USA (mpg) and Japan, the Netherlands (km/L). If mpg is used, it is important to know which gallon is being referred to; the U.S. gallon or the imperial gallon. The imperial gallon is about 20% larger than the U.S. gallon. Higher values of mpg means travelling further for the same amount of fuel.
Fuel economy and fuel consumption are reciprocal quantities. To convert between L/100 km and miles per US gallon, divide 235 by the number in question. For miles per imperial gallon, divide 282 by the number in question. For example, to convert from 30 mpg (US) to L/100 km, divide 235 by 30, giving 7.83 L/100 km; or from 10 L/100 km to mpg (US), divide 235 by 10, giving 23.5 mpg. To convert between L/100 km and km/L, divide 100 by the number in question.
A related measure is the amount of carbon dioxide produced as a result of the combustion process, typically measured in grams of CO2 per kilometre (CO2 g/km). A petrol (gasoline) engine will produce around 2.32 kg of carbon dioxide for each litre of petrol consumed (19.4 lb/gal). A typical diesel engine produces 2.66 kg/L (22.23 lb/gal) though typically burns fewer litres per kilometre for an otherwise identical car. Since the CO2 emissions are relatively constant per litre, they are proportional to fuel consumption.
Inverse or reciprocal scale
A modest improvement in fuel economy for a relatively inefficient vehicle can provide greater savings in terms of financial cost to the driver and environmental impact than a proportionately larger increase for a more economical vehicle. This is most intuitively demonstrated using the inverse scale - gallons per mile or liters per kilometer. If a driver who travels 15,000 miles (24,000 km) a year switches from a vehicle with 10 mpg to 12 mpg average fuel economy (0.10 gallons per mile to 0.083 gallons per mile), 250 gallons are saved. A similar 20% improvement in exchanging a 30 mpg for a 36 mpg (0.033 gallons per mile for 0.027) vehicle saves only 83 gallons. Because mpg and fuel consumption are inversely related, mpg can cause illusions. Gallons Per Mile is more useful than mpg when comparing the fuel consumption of different cars.
One should note that MPG works differently than litres per hundred kilometres. l/100 km denotes a rate of fuel consumption, while MPG is a measure of fuel economy (or 'gas mileage'). If a car uses less fuel, the MPG increases, and l/100 km decreases, but the percentages will not match, because the values are reciprocal.
For example, 20% better MPG does not mean 20%, but 16.7% less fuel. This comes from the following calculation: 20% is 1.2 times bigger distance, therefore 100% / 1.2 = 83.3% of the original fuel consumption, or 16.7% less fuel.
Because consumption is an inverse function of MPG, MPG can be a misleading indicator of fuel efficiency gains. People intuitively take the difference in MPG when comparing two cars. This leads them to underestimate the savings from small improvements on low MPG cars (e.g., 14 to 20 MPG, which saves twice as much fuel over a given distance as the improvement from 33 to 50 MPG ). A measure of gallons per mile (GPM), such as gallons per 100 miles, provides an accurate view of consumption for a given distance of driving. Unlike MPG, the GPM of one car can be subtracted from the GPM of another car to get a direct measure of fuel savings.
Gallons per mile
Gallons per mile (GPM) is a way of measuring the fuel efficiency of a vehicle. It conveys the amount of fuel that will be used more intuitively than Miles per gallon, which can be misleading. For example, many people incorrectly believe that the improvement from 34 to 44 MPG saves more fuel than the improvement from 15 to 19 MPG because they look at the difference (or percentage change) between MPG levels. The improvement of 15 to 19 MPG change saves about twice as much fuel as the improvement of 34 to 44 MPG over a given distance of driving. "Gallons per 100 miles" (GPHM) corrects these illusions. When comparing the fuel savings of different vehicles, GPHM can be subtracted. MPG cannot.
Because using "gallons per mile" yields small numbers, it is useful to use a longer distance as the base, such as "gallons per hundred miles" (GPHM) or "gallons per 10,000 miles." Many countries use a measure of volume over distance to measure fuel consumption.
The following table shows how MPG translates to "gallons per 100 miles" (GPHM) and gallons per 10,000 miles (GP10K), with small rounding:
| MPG | GPHM | GP10K |
|---|---|---|
| 10 | 10 | 1,000 |
| 11 | 9 | 909 |
| 12.5 | 8 | 800 |
| 14 | 7 | 714 |
| 16.5 | 6 | 606 |
| 20 | 5 | 500 |
| 25 | 4 | 400 |
| 33 | 3 | 303 |
| 50 | 2 | 200 |
| 100 | 1 | 100 |
A focus on fuel consumption makes clear the benefits of removing the most inefficient vehicles, as in the Car Allowance Rebate System program. Seemingly small MPG improvements on inefficient cars saves a large amount of fuel over a given distance of driving. For example, replacing a car that gets 14 MPG with a car that gets 25 MPG saves 3 gallons of fuel every 100 miles. That improvement saves more fuel than can be saved by any improvement to a 33 MPG vehicle. Because a gallon of fuel emits 20 pounds of carbon dioxide, saving 3 gallons of fuel every 100 miles saves 3 tons of carbon dioxide every 10,000 miles of driving.
Fuel economy statistics
While the ability of petroleum engines to maximize the transformed chemical energy of the fuel (their fuel efficiency) has increased since the beginning of the automotive era, this has not necessarily translated into increased fuel economy or decreased fuel consumption, which is additionally affected by the mass, shape, and size of the car, and the goals of an automobile's designers, which may be to produce greater power and speed rather than greater economy and range. Right now,the US automilage standards are 26.4 miles per gallon.
The choice of car and how it is driven drastically affects the fuel economy. A top fuel dragster can consume 6 U.S. gallons (23 L) of nitromethane for a quarter-mile (400 m) run in about 4.5 seconds, which comes out to 24 U.S. gallons per mile (5,600 L per 100 km). The other extreme was set by PAC-Car II in the 2005 Eco-Marathon, which managed 5384 kilometres per litre (15,210 mpg-imp; 12,660 mpg-US).
Both such vehicles are extremes, and most people drive ordinary cars that typically average 15 to 40 miles per U.S. gallon (19 to 50 miles per imperial gallon) or (5.6 to 15 L per 100 km). However, due to environmental concerns caused by CO2 emissions, new EU regulations are being introduced to reduce the average emissions, of cars sold beginning in 2012, to 130 g/km of CO2, equivalent to 4.5 L per 100 km (52 mpg US, 63 MPG imperial) for a diesel-fueled car, and 5.0 L per 100 km (47 mpg US, 56 MPG imperial) for a gasoline (petrol)-fueled car. EU fuel economy testing is done on a rolling road with two segments, ECE15 and EUDC, which correspond to city and highway driving, respectively. The city driving cycle simulates a 4,052 m (2.5 mile) urban trip at an average speed of 18.7 km/h (11.6 mph) and at a maximum speed of 50 km/h (31 mph), while the highway cycle lasts 400 seconds (6 minutes 40 seconds) at an average speed 62.6 km/h (39 mph) and a top speed of 120 km/h (74.6 mph).
It should be borne in mind that the average consumption across the fleet is not immediately directly affected by the new vehicle fuel economy, for example Australia's car fleet average in 2004 was 11.5 L/100 km (20.5 mpgUS), compared with the average new car consumption in the same year of 25.3 mpgUS
Physics
The power to overcome air resistance increases roughly with the cube of the speed, and thus the energy required per unit distance is roughly proportional to the square of speed. Because air resistance increases so rapidly with speed, above about 30 mph (48 km/h), it becomes a dominant limiting factor. Driving at 45 rather than 65 mph (72 rather than 105 km/h) results in about one-third the power to overcome wind resistance, or about one-half the energy per unit distance, and much greater fuel economy can be achieved. Increasing speed to 90 mph (145 km/h) from 65 mph (105 km/h) increases the power requirement by 2.6 times, the energy by 1.9 times, and decreases fuel economy. In real world vehicles the change in fuel economy is less than the values quoted above due to complicating factors.
The power needed to overcome the rolling resistance is roughly proportional to the speed, and thus the energy required per unit distance is roughly constant. At very low speeds the dominant losses are internal friction. A hybrid can achieve greater fuel economy in city driving than on the highway because the engine shuts off when it is not needed to charge the battery and has little to no consumption at stops. In addition, regenerative braking puts energy back into the battery.
Speed and fuel economy studies
1997 fuel economy statistics for various U.S. models
Fuel economy at steady speeds with selected vehicles was studied in 2010. The most recent study indicates greater fuel efficiency at higher speeds than earlier studies; for example, some vehicles achieve better mileage at 65 than at 45 mph (72 rather than 105 km/h), although not their best economy, such as the 1994 Oldsmobile Cutlass, which has its best economy at 55 mph (29.1 mpg), and gets 2 mpg better economy at 65 than at 45 (25 vs 23 mpg). All cars demonstrated decreasing fuel economy beyond 65 mph (105 km/h), with wind resistance the dominant factor, and may save up to 25% by slowing from 70 mph (110 km/h) to 55 mph (89 km/h). However, the proportion of driving on high speed roadways varies from 4% in Ireland to 41% in Netherlands.
There were complaints when the U.S. National 55 mph (89 km/h) speed limit was mandated that it could lower, instead of increase fuel economy. The 1997 Toyota Celica, got 1 mpg better fuel-efficiency at 65 than it did at 55 (43.5 vs 42.5), although almost 5 mpg better at 60 than at 65 (48.4 vs 43.5), and its best economy (52.6 mpg) at only 25 mph (40 km/h). Other vehicles tested had from 1.4 to 20.2% better fuel-efficiency at 55 mph (89 km/h) vs. 65 mph (105 km/h). Their best economy was reached at speeds of 25 to 55 mph (see graph).
Differing measuring regimes
Lexus IS 250 - petrol 2.5 L 4GR-FSE V6, 204 hp (153 kW), 6 speed automatic, rear wheel drive
Australia (L/100 km) - 'combined' 9.1, 'urban' 12.7, 'extra-urban' 7.0
European Union (L/100 km) - 'combined' 8.9, 'urban' 12.5, 'extra-urban' 6.9
United States (L/100 km) - 'combined' 9.8, 'city' 11.2, 'highway' 8.1
Fuel economy standards
Gasoline new passenger car fuel efficiency
Country 2004 average Requirement
2004 2005 2008 Later
People's Republic of China 6.1 L/100 km 5.7 L/100 km
United States 24.6 mpg (9.5 L/100 km) (cars and trucks)* 27 mpg (8.7 L/100 km) (cars only)* 35.5 mpg (6.6 L/100 km) (2016)
European Union 5 L/100 km (2012)
Japan[15] 6.7 L/100 km CAFE eq (2010)
Australia 8.08 L/100 km CAFE eq (2002) none 6.7 L/100 km CAFE eq (2010) (voluntary)
* highway ** combined
Australia
Beginning in October, 2008, all new cars will need to be sold with a sticker on the windscreen showing the fuel consumption and the CO2 emissions. Fuel consumption figures are expressed as urban, extra urban and combined. Previously, only the combined number was given.
Australia also uses a star rating system, from one to five stars, that combines greenhouse gases with pollution, rating each from 0 to 10 with ten being best. To get 5 stars a combined score of 16 or better is needed, so a car with a 10 for economy (greenhouse) and a 6 for emission or 6 for economy and 10 for emission, or anything in between would get the highest 5 star rating. The lowest rated car is the Ssangyong Korrando with automatic transmission, with one star, while the highest rated was the Toyota Prius hybrid. The Fiat 500, Fiat Punto and Fiat Ritmo as well as the Citroen C3 also received 5 stars. The greenhouse rating depends on the fuel economy and the type of fuel used. A greenhouse rating of 10 requires 60 or less grams of CO2 per km, while a rating of zero is more than 440 g/km CO2. The highest greenhouse rating of any 2009 car listed is the Toyota Prius, with 106 g/km CO2 and 4.4 litres per 100 kilometres (64 mpg-imp; 53 mpg-US). Several other cars also received the same rating of 8.5 for greenhouse. The lowest rated was the Ferrari 575 at 499 g/km CO2 and 21.8 litres per 100 kilometres (13.0 mpg-imp; 10.8 mpg-US). The Bentley also received a zero rating, at 465 g/km CO2. The best fuel economy of any year is the 2004–2005 Honda Insight, at 3.4 litres per 100 kilometres (83 mpg-imp; 69 mpg-US).
Europe
Irish fuel economy label.
In the European Union advertising has to show Carbon dioxide (CO2)-emission and fuel consumption data in a clear way as described in the UK Statutory Instrument 2004 No 1661. Since September 2005 a color-coded "Green Rating" sticker has been available in the UK which rates fuel economy by CO2 emissions: A: <= 100 g/km, B: 100 - 120, C: 121 - 150, D: 151 - 165, E: 166 - 185, F: 186 - 225, and G: 226+. Depending on the type of fuel used, for gasoline A corresponds to about 4.1 litres per 100 kilometres (69 mpg-imp; 57 mpg-US) and G about 9.5 litres per 100 kilometres (30 mpg-imp; 25 mpg-US). Ireland has a very similar label, but the ranges are slightly different, with A: <= 120 g/km, B: 121 - 140, C: 141 - 155, D: 156 - 170, E: 171 - 190, F: 191 - 225, and G: 226+.
[edit]New Zealand
Starting on 7 April 2008 all cars of up to 3.5 tonnes GVW sold other than private sale need to have a fuel economy sticker applied (if available) which shows the rating from one half star to six stars with the most economic cars having the most stars and the more fuel hungry cars the least, along with the fuel economy in L/100 km and the estimated annual fuel cost for driving 14,000 km. The stickers must also appear on vehicles to be leased for more than 4 months. All new cars currently rated range from 6.9 litres per 100 kilometres (41 mpg-imp; 34 mpg-US) to 3.8 litres per 100 kilometres (74 mpg-imp; 62 mpg-US) and received respectively from 4.5 to 5.5 stars.
United States
US Energy Tax Act
The Energy Tax Act of 1978[30] in the U.S. established a gas guzzler tax on the sale of new model year vehicles whose fuel economy fails to meet certain statutory levels. The tax applies only to cars (not trucks) and is collected by the IRS. Its purpose is to discourage the production and purchase of fuel-inefficient vehicles. The tax was phased in over ten years with rates increasing over time. It applies only to manufacturers and importers of vehicles, although presumably some or all of the tax is passed along to automobile consumers in the form of higher prices. Only new vehicles are subject to the tax, so no tax is imposed on used car sales. The tax is graduated to apply a higher tax rate for less-fuel-efficient vehicles. To determine the tax rate, manufacturers test all the vehicles at their laboratories for fuel economy. The U.S. Environmental Protection Agency confirms a portion of those tests at an EPA lab.
EPA testing procedure through 2007
Two separate fuel economy tests simulate city driving and highway driving: the city driving program consists of starting with a cold engine and making 23 stops over a period of 31 minutes for an average speed of 20 mph (32 km/h) and with a top speed of 56 mph (90 km/h); the highway program uses a warmed-up engine and makes no stops, averaging 48 mph (77 km/h) with a top speed of 60 mph (97 km/h) over a 10 mile (16 km) distance. The measurements are then adjusted downward by 10% (city) and 22% (highway) to more accurately reflect real-world results. A weight average of city (55%) and highway (45%) fuel economies is used to determine the tax.
In some cases, this tax may only apply to certain variants of a given model; for example, the 2004–2006 Pontiac GTO did incur the tax when ordered with the four-speed automatic transmission, but did not incur the tax when ordered with the six-speed manual transmission.
Because EPA figures had almost always indicated better efficiency than real-world fuel-efficiency, the EPA has modified the method starting with 2008. Updated estimates are available for vehicles back to the 1985 model year.
EPA testing procedure: 2008 and beyond
New fuel economy label.
As a means of reflecting real world fuel economy more accurately, the EPA adds three new tests that will combine with the current city and highway cycles to determine fuel economy of new vehicles, beginning with the 2008 model year. A high speed/quick acceleration loops lasts 10 minutes, covers 8 miles (13 km), averages 48 mph (77 km/h) and reaches a top speed of 80 mph (130 km/h). Four stops are included, and brisk acceleration maximizes at a rate of 8.46 mph (13.62 km/h) per second. The engine begins warm and air conditioning is not used. Ambient temperature varies between 68 °F (20 °C) to 86 °F (30 °C).
The air conditioning test raises ambient temperatures to 95 °F (35 °C), and the vehicle's climate control system is put to use. Lasting 9.9 minutes, the 3.6-mile (5.8 km) loop averages 22 mph (35 km/h) and maximizes at a rate of 54.8 mph (88.2 km/h). Five stops are included, idling occurs 19 percent of the time and acceleration of 5.1 mph/sec is achieved. Engine temperatures begin warm. Lastly, a cold temperature cycle uses the same parameters as the current city loop, except that ambient temperature is set to 20 °F (−7 °C).
EPA tests for fuel economy do not include electrical load tests beyond climate control which may account for some of the discrepancy between EPA and real world fuel-efficiency. A 200 W electrical load can produce a 0.4 km/L reduction in efficiency on the FTP 75 cycle test.
Following the efficiency claims made for vehicles such as Chevrolet Volt and Nissan Leaf, the National Renewable Energy Laboratory recommended to use EPA's new vehicle fuel efficiency formula that gives different values depending on fuel used. Meanwhile an Israeli firm last urged the EPA to come up with a three-pronged number that would tell people how much electricity a car uses when it's fully charged, how much electricity it takes to charge the car and how much gas the car uses when it's battery is depleted.
CAFE standards
Corporate Average Fuel Economy
The Corporate Average Fuel Economy (CAFE) regulations in the United States, first enacted by Congress in 1975, are federal regulations intended to improve the average fuel economy of cars and light trucks (trucks, vans and sport utility vehicles) sold in the US in the wake of the 1973 Arab Oil Embargo. Historically, it is the sales-weighted average fuel economy of a manufacturer's fleet of current model year passenger cars or light trucks, manufactured for sale in the United States. Under Truck CAFE standards 2008–2011 this changes to a "footprint" model where larger trucks are allowed to consume more fuel. The standards are limited to vehicles under a certain weight, but those weight classes will be expanding in 2011 if current law (as of April 2006) holds.
State regulations
The states are pre-empted by federal law, and are not allowed to make fuel efficiency standards. However, California has a special dispensation from the Clean Air Act to make emissions standards (which other states may adopt instead of the federal standards). The California Air Resources Board is implementing some legislation which limits greenhouse gas emissions. A legal dispute has emerged over whether this is effectually a fuel efficiency standard.
Energy considerations
Since the total force that a vehicle faces (that is the total force opposing the vehicle's motion) multiplied by the distance through which the vehicle travels represents the work that the vehicle's engine must generate, the study of mileage (the amount of energy consumed per unit of distance) requires a detailed analysis of the forces that oppose a vehicle's motion. In terms of physics, Force = rate at which the amount of work generated (energy delivered) varies with the distance travelled, or:
Note: The amount of work generated by the vehicle's power source (energy delivered by the engine) would be exactly proportional to the amount of fuel energy consumed by the engine if the engine's efficiency is the same regardless of power output, but this is not necessarily the case due to the operating characteristics of the internal combustion engine.
For a vehicle whose source of power is a heat engine (an engine that uses heat to perform useful work), the amount of fuel energy that a vehicle consumes per unit of distance (level road) depends upon:
The thermodynamic efficiency of the heat engine;
The forces of friction within the mechanical system that delivers engine output to the wheels;
The forces of friction in the wheels and between the road and the wheels (rolling friction);
Other internal forces that the engine works against (electrical generator, air conditioner etc., water pump, engine fan etc.);
External forces that resist motion (e.g., wind, rain);
Non-regenerative braking force (brakes which turn motion energy into heat rather than storing it in a useful form; e.g., electrical energy in hybrid vehicles).
Energy dissipation in city and highway driving.
Ideally, a car traveling at a constant velocity on level ground in a vacuum with frictionless wheels could travel at any speed without consuming any energy beyond what is needed to get the car up to speed. Less ideally, any vehicle must expend energy on overcoming road load forces, which consist of aerodynamic drag, tire rolling resistance, and inertial energy that is lost when the vehicle is decelerated by friction brakes. With ideal regenerative braking, the inertial energy could be completely recovered, but there are few options for reducing aerodynamic drag or rolling resistance other than optimizing the vehicle's shape and the tire design. Road load energy, or the energy demanded at the wheels, can be calculated by evaluating the vehicle equation of motion over a specific driving cycle . The vehicle powertrain must then provide this minimum energy in order to move the vehicle, and will lose a large amount of additional energy in the process of converting fuel energy into work and transmitting it to the wheels. Overall, the sources of energy loss in moving a vehicle may be summarized as follows:
Engine efficiency, which varies with engine type, the mass of the automobile and its load, and engine speed (usually measured in RPM).
Aerodynamic drag force, which increases roughly by the square of the car's speed, but note that drag power goes by the cube of the car's speed.
Rolling friction.
Braking, although regenerative braking captures some of the energy that would otherwise be lost.
Losses in the transmission. (Manual transmissions can be up to 94% efficient whereas older automatic transmissions may be as low as 70% efficient Automatically controlled shifting of gearboxes that have the same internals as manual boxes will give the same efficiency as a pure manual gearbox plus the bonus of added intelligence selecting optimal shifting points
Air conditioning. The power required for the engine to turn the compressor decreases the fuel-efficiency, though only when in use. This may be offset by the reduced drag of the vehicle compared with driving with the windows down. The extra mass of the air conditioning system will cause a slight increase in fuel consumption.
Power steering. Older hydraulic power steering systems are powered by a hydraulic pump constantly engaged to the engine. Power assistance required for steering is inversely proportional to the vehicle speed so the constant load on the engine from a hydraulic pump reduces fuel efficiency. More modern designs improve fuel efficiency by only activating the power assistance when needed typically this is done by using either direct electrical power steering assistance or an electrically powered hydraulic pump.
Cooling. Older cooling systems used a constantly engaged mechanical fan to draw air through the radiator at a rate directly related to the engine speed. This constant load reduces efficiency. More modern systems use electrical fans to draw additional air through the radiator when extra cooling is required.
Electrical systems. Headlights, battery charging, active suspension, circulating fans, defrosters, media systems, speakers, and other electronics can also significantly increase fuel consumption, as the energy to power these devices causes increased load on the alternator. Since alternators are commonly only 40-60% efficient, the added load from electronics on the engine can be as high as 3 horsepower (2.2 kW) at any speed including idle. In the FTP 75 cycle test, a 200 watt load on the alternator reduces fuel efficiency by 1.7 mpg. Headlights, for example, consume 110 watts on low and up to 240 watts on high. These electrical loads can cause much of the discrepancy between real world and EPA tests which only include the electrical loads required to run the engine and basic climate control.
Fuel-efficiency decreases from electrical loads are most pronounced at lower speeds because most electrical loads are constant while engine load increases with speed. So at a lower speed a higher proportion of engine horsepower is used by electrical loads. Hybrid cars see the greatest effect on fuel-efficiency from electrical loads because of this proportional effect.
[edit]Fuel economy-boosting technologies
Main article: Fuel saving devices
Using lighter materials for moving parts such as pistons, crankshaft, gears and alloy wheels
Using thinner engine oils that require less energy to circulate
Reducing the volume of water-based cooling systems so that engines reach their efficient operating temperature sooner
Using coolant additives that increase the thermal efficiency of the cooling system
Designing the exterior of the vehicle to reduce aerodynamic drag
Replacing tires with low rolling resistance (LRR) models[39]
Using lower-friction lubricants (engine oil, transmission fluid, axle fluid)
Incorporating Locking torque converters in automatic transmissions to reduce slip and power losses in the converter
Using a manual gearbox or continuously variable transmission automatic gearbox instead of epicyclic gearboxes with torque converter couplings
Increasing the number of gearbox ratios in manual gearboxes
Augmenting a downsized engine with an electric drive system and battery (hybrid vehicles) hybrid electric vehicle
Replacing petrol engines with more efficient diesel engines
Installing an alternator disconnect and supplying electrical system from deep cycle battery pack which is charged at home (although the added weight of the larger battery would have to be considered in calculating the possible fuel savings from this concept)
Automatically shutting off engine when vehicle is stopped (mild hybrid)
Recapturing wasted energy while braking (regenerative braking)
Recapturing wasted energy in the vehicle suspension
The use of two-wheel drive only, on road vehicles not used for towing
Optimising other engine combustion strategies:
Optimising engine running temperature by electronic control of the cooling system
Stratified Charge combustion
Lean burn combustion
HCCI (Homogeneous Charge Compression Ignition) combustion
Variable valve timing
Supercharging or twincharging (when coupled with a downsized engine)
Turbocharged Direct Injection diesel engines
Gasoline direct injection petrol engines
Common Rail diesel engines
Variable geometry turbocharging
Reducing vehicle weight by using materials such as aluminum, fiberglass, plastic, high-strength steel and carbon fiber instead of mild steel and iron
Reducing vehicle weight by improving vehicle packaging and space utilisation to enable downsizing without loss of functionality
Active highway management (matching speed limits and vehicles allowed to join motorways/freeways to traffic density), to maintain traffic throughput and fuel efficiency.
Future technologies
Technologies that may improve fuel efficiency, but are not yet on the market, include:
Compound engines
Two-stroke diesel engines
High-efficiency gas turbine engines
BMW's Turbosteamer - using the heat from the engine to spin a mini turbine to generate power
Vehicle electronic control systems that automatically maintain distances between vehicles on motorways/freeways that reduce ripple back braking, and consequent re-acceleration.
Time-optimized piston path, to capture energy from hot gases in the cylinders when they are at their highest temperatures
Many aftermarket consumer products exist which are purported to increase fuel economy; many of these claims have been discredited. In the United States, the Environmental Protection Agency maintains a list of devices that have been tested by independent laboratories and makes the test results available to the public.
Fuel economy data reliability
The mandatory publication of the fuel consumption by the manufacturer led some to use dubious practices to reach better values in the past. If the test is on a test stand, the vehicle may detect open doors and adapt the engine control. Also when driven according to the test regime, the parameters may adapt automatically. Test laboratories use a "golden car" that is tested in each one to check that each lab produces the same set of measurements for a given drive cycle.
Correctly aligning the vehicle wheels is something that should be normal practice for the vehicle users. Tire pressures and lubricants have to be as recommended by the manufacturer (Higher tire pressures are required on a particular dyno type, but this is to compensate for the different rolling resistance of the dyno, not to produce an unrealistic load on the vehicle). Normally the quoted figures a manufacturer publishes have to be proved by the relevant authority witnessing vehicle/engine tests. A lot of Governments independently test emissions from customer vehicles, and as a final measure can force a recall of all of a particular type of vehicle if the customer vehicles do not fulfil manufacturers' claims within reasonable limits. The expense and bad publicity from such a recall means manufacturers should be very cautious not to publish unrealistic figures. The US Federal government retests 10-15% of models), to make sure that the manufacturer's tests are accurate.
Concerns over EPA estimates
For many years critics have claimed that EPA estimated fuel economy figures have been misleading. The primary arguments of the EPA detractors were focused on the lack of real world testing, and the very limited scale (i.e., city or highway).
EPA changes in 2008
Partly as a response to these criticisms, the EPA changed their fuel economy rating system in 2008 in an attempt to more adequately address these concerns. Instead of testing simply in two presumed modes, the testing now covers:
Faster speeds and acceleration
Air conditioner user
Colder outside temperatures
Other attempts to improve MPG accuracy
While the new EPA standards may represent an improvement, real world user data may still be the best way to gather and collect accurate fuel economy information. As such the EPA has also set up a http://www.fueleconomy.gov/mpg/MPG.do?action=browseList website where drivers can enter and track their own real-world fuel economy numbers.
There are also a number of websites that attempt to track and report individual user fuel economy data. Sites or publications such as Consumer Reports, Edmunds.com, and TrueDelta.com offer this service and claim more accurate numbers than those listed by the EPA.
Fuel economy maximizing behaviors
Governments, various environmentalist organizations, and companies like Toyota and Shell Oil Company have historically urged drivers to maintain adequate air pressure in tires and careful acceleration/deceleration habits.
Fuel economy as part of quality management regimes
Environmental management systems EMAS as well as good fleet management do include record keeping of the fuel consumption of the fleet. Quality management on top of this uses those figures to steer the measures acting on the fleets. You may check whether procurement, driving, and maintenance in total have contributed to changes in the fleets overall consumption.
Units
Miles per gallon (MPG) is a unit of measurement that measures fuel economy in automobiles, that is, how many miles a vehicle can travel on one gallon of fuel. It is used similarly in United States and the United Kingdom, although the US gallon is about 83% of the Imperial gallon used in the UK.
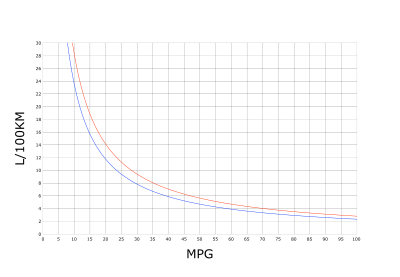
MPG to L/100km conversion chart: blue, liq. gal. (US); red, imp. gal. (UK).
Most countries other than the US and UK use the metric units litre (approximately 0.220 Imperial gallons or 0.264 US liquid gallons) and km (approximately 0.621 statute miles). These can be combined to either km/l (efficiency) or l/100 km (consumption). The UK is a special case in this respect, as distances are measured in miles but fuel is sold by the litre. As a result, both MPG and l/100 km are usually quoted for any given vehicle. Note that because the imperial gallon is significantly larger than the U.S. gallon, MPG figures are 20.095% higher in the UK than in the U.S. for the same real fuel economy.
US Gallons
1 MPG ≈ 0.425 km/l
235/MPG ≈ l/100 km
1 MPG ≈ 1.201 MPG (Imp)
Imperial gallons
1 MPG ≈ 0.354 km/l
282/MPG ≈ l/100 km
1 MPG ≈ 0.833 MPG (US)
Conversion Tables
The conversion tables give a quick overview of the relationship between the different measurement units, MPG (US), MPG (Imperial), km/l, and l/100 km.
Read More: Fuel economy-maximizing behaviors, Fuel efficiency in transportatio, Vehicle Efficiency Initiative, Fuel efficiency
(source:wikipedia)
Just i was searching for some data for my next academic presentation on Automotive Green Technology, energy system. this post provided me a lot of information which is very useful and real facts, thanks for posting lol.
ReplyDeleteGeorgia Drivers Ed
It's was very insight full documentation, which give me more knowledge on no of ways of representing the fuel consumption, geo locational changes in representing, speed vs fuel economy and alot more, thank you very mush for providing such a good article.
ReplyDeleteNevada Learners Permit
Thanks for your info. I will be useful for many peoples.
ReplyDeleteUsed cars